안드로이드용 챠트 라이브러리를 이 것 저 것 찾아보고 있는데…
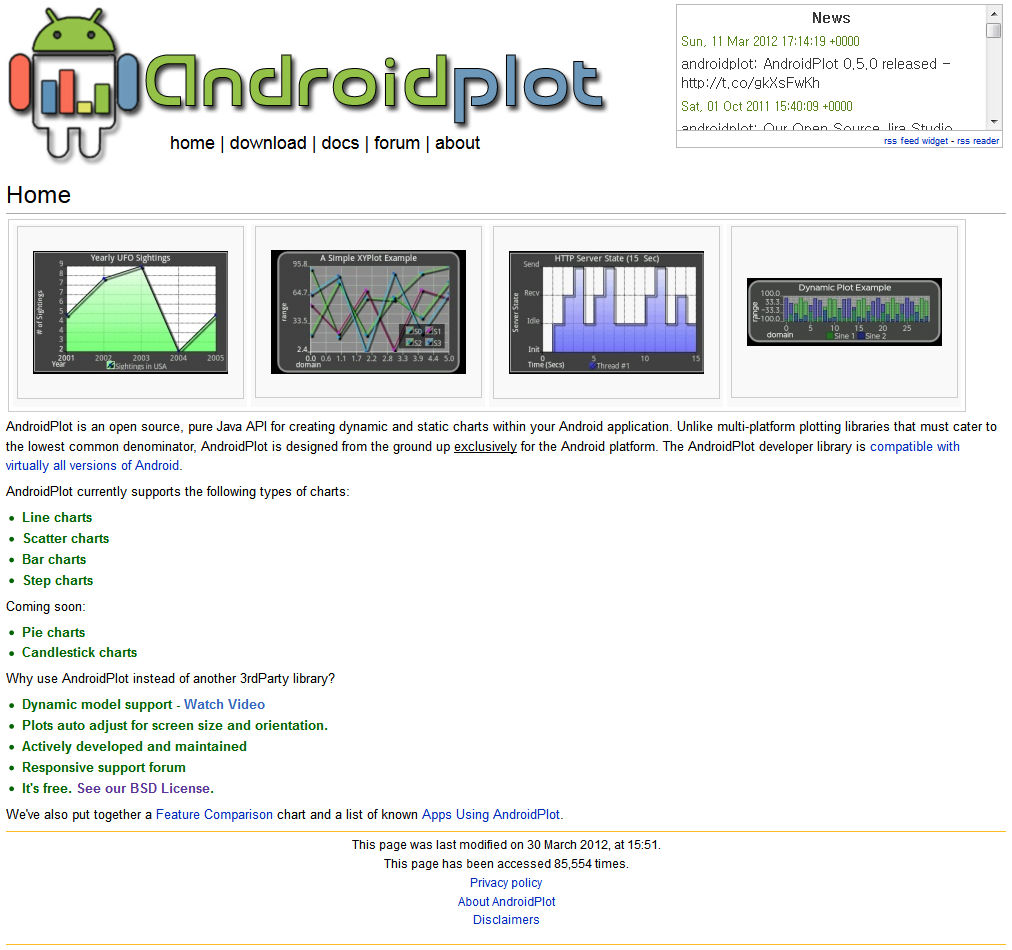
AndroidPlot라는게 간단하게 사용할 수 있을 것 같다.
현재 Line 챠트, Scatter 챠트, Bar 챠트, Step 챠트를 지원하며, Pie 챠트도 준비하고 있단다.
라이센스는 BSD 라이센스인데…상용이든 공개용이든 거의 제한없이 쓸 수 있다고 한다.
라이브러리는 아래의 링크에서 다운받을 수 있다.
http://androidplot.com/wiki/Home
Overview
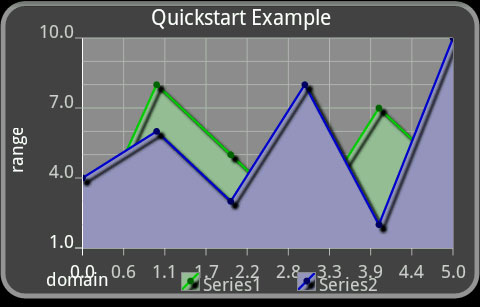
This tutorial will show you the bare essentials of how to display two series of data stored as Number arrays in an XYPlot.
Step 1: Create the project
This step really depends on which IDE (if any) that you use. Google already has some pretty good documentation on the process. Our recommendations would be to go with either IntelliJ IDEA or Eclipse with ADT. Here are a few links that might be useful:
For a quick refresher on creating a basic Android project in Eclipse:
- File — New — Other…
- Android — Android Project
- Fill in the information for your desired project and select a build target of 2.0 or greater (minimum for AndroidPlot).
- Click finish.
Step 2: Add the AndroidPlot library to the project
This step is also IDE dependent. We’ll only cover the steps for Eclipse and IntelliJ IDEA here.
IntelliJ IDEA
TODO
Eclipse
Now that your project has been created, you must add the AndroidPlot library to the build path:
- Locate the newest AndroidPlot library (the core release, not the javadoc) that you downloaded. For instance, “Androidplot-core-0.4a-release.jar.”
- Copy this .jar file.
- In Eclipse, create a new folder directly underneath the main application folder (where src and gen are). Name the folder “lib” without the ” “.
- Right click this new folder, and paste the .jar file.
- The library is now part of your project, but you must add it to the build path before you reference it.
- Still in Eclipse, right click the .jar you added and select the “Build Path — Add to Build Path” option.
- It will now show up under Referenced Libraries. You are all set!
Step 3: Add an XYPlot to main.xml
Once you’ve got the project skeleton created, it’s time to edit /res/layout/main.xml and add an XYPlot view:
main.xml
<?xml version="1.0" encoding="utf-8"?>
<LinearLayout xmlns:android="http://schemas.android.com/apk/res/android"
	android:orientation="vertical"
	android:layout_width="fill_parent"
	android:layout_height="fill_parent">

	<com.androidplot.xy.XYPlot
		android:id="@+id/mySimpleXYPlot"
		android:layout_width="fill_parent"
		android:layout_height="100px"
		android:layout_marginTop="10px"
		android:layout_marginLeft="10px"
		android:layout_marginRight="10px"
		title="A Simple XYPlot Example"
		/>
</LinearLayout>
TODO
Step 4: Create the Activity
The example below uses com.example as it’s package – change this to whatever package you used when you created your project in step 1.
MyActivity.java
import android.app.Activity;
import android.graphics.Color;
import android.os.Bundle;
import com.androidplot.xy.SimpleXYSeries;
import com.androidplot.series.XYSeries;
import com.androidplot.xy.*;

import java.text.DecimalFormat;
import java.util.Arrays;

public class MyActivity extends Activity
{
	private XYPlot mySimpleXYPlot;

	@Override
	public void onCreate(Bundle savedInstanceState)
	{
		super.onCreate(savedInstanceState);
		setContentView(R.layout.main);

		// Initialize our XYPlot reference:
		mySimpleXYPlot = (XYPlot) findViewById(R.id.mySimpleXYPlot);

		// Create two arrays of y-values to plot:
		Number[] series1Numbers = {1, 8, 5, 2, 7, 4};
		Number[] series2Numbers = {4, 6, 3, 8, 2, 10};

		// Turn the above arrays into XYSeries:
		XYSeries series1 = new SimpleXYSeries(
				Arrays.asList(series1Numbers),		  // SimpleXYSeries takes a List so turn our array into a List
				SimpleXYSeries.ArrayFormat.Y_VALS_ONLY, // Y_VALS_ONLY means use the element index as the x value
				"Series1");							 // Set the display title of the series

		// Same as above, for series2
		XYSeries series2 = new SimpleXYSeries(
				Arrays.asList(series2Numbers),
				SimpleXYSeries.ArrayFormat.Y_VALS_ONLY,
				"Series2");

		// Create a formatter to use for drawing a series using LineAndPointRenderer:
		LineAndPointFormatter series1Format = new LineAndPointFormatter(
				Color.rgb(0, 200, 0),				   // line color
				Color.rgb(0, 100, 0),				   // point color
				Color.rgb(150, 190, 150)); 		    // fill color (optional)

		// Add series1 to the xyplot:
		mySimpleXYPlot.addSeries(series1, series1Format);

		// Same as above, with series2:
		mySimpleXYPlot.addSeries(series2,
				new LineAndPointFormatter(Color.rgb(0, 0, 200),
				Color.rgb(0, 0, 100),
				Color.rgb(150, 150, 190)));

		// Reduce the number of range labels
		mySimpleXYPlot.setTicksPerRangeLabel(3);

		// By default, AndroidPlot displays developer guides to aid in laying out your plot.
		// To get rid of them call disableAllMarkup():
		mySimpleXYPlot.disableAllMarkup();
	}